
 English
 French
 Pubmed
 Google Scholar
 Cross Ref
 Visitor 725689
Agreement of sleep stages measured by respiratory polygraphy integrated actigraphy vesus polysomnography
Concordance des stades du sommeil mesurés par polygraphie respiratoire actigraphie intégrée versus polysomnographie
K. Le-Thai-Thanh1, A. Nguyen-Viet1, M. Quach-Thieu1, QB. Le-Gia1, D. Truong-Huu1, N. Vo-Dinh1, A. Nguyen-Tuan2,3, T.Tran-Thi-Cam3, TT. Tang-Thi2,3, T. Nguyen-Van2,3, S. Duong-Quy2,3,4
1: Faculty of Medicine, University of Medicine and Pharmacy at Ho Chi Minh City, Vietnam
2: Lam Dong Medical College, Dalat, Vietnam
3: Vietnam Society of Sleep Medicine, Dalat, Vietnam
4: Penn Sate Medical College, PA, USA
Corresponding author
Pr. Sy Duong-Quy
MD, PhD, FCCP. Vietnam Society of Sleep Medicine. Dalat, Vietnam
E-mail: sduongquy.jfvp@gmail.com
DOI: 10.12699/jfvpulm.12.37.2021.1
Objectives. This study aimed to measure the agreement of the sleep stages measurement on type III portable monitor, integrated actigraphy polygraphy (PG) to that of simultaneous recorded in-lab portable polysomnography (PSG) testing.
Methods. A total of 12 participants were referred to sleep medicine laboratory. Each volunteer were applied both PSG and PG equipment simultaneously. The collected measurements are AHI, CAI, OAI, MAI, lowest SpO2, average SpO2, total sleep time, REM time, NON – REM time, and other metrics, which were analyzed by NOXTURAL software. For PG NOX T3s , sleep stages were estimated from recordings based on features extracted from actigraphy and respiratory inductance plethysmography (RIP) belts by Nox BodySleep™ algorithm.
Results. Good correlation was found in TST on NOX-A1 and NOX-T3 (paired t-test p=0.266); Spearman’rho=0.944, p<0.001). Bland-Altman analysis of TST showed a mean different of -6.33 with limits of agreement was -6.88 to 8.03 in TST, which illustrates close agreement of TST on two devices. AHI measured by T3s without nasal sensor did not show a good level of agreement compared with NOX-A1, with the mean different was -2.28 and limits of agreement were -6.76 to 2.2.
Conclusions. NOX T3s demonstrated a good agreement about TST when compared to PSG. Therefore, NOX T3s can be used to assess the sleep efficiency on the patients having sleep disorders and to evaluate AHI correctly according to TST.
KEYWORDS: Actigraphy; Home sleep apnea testing: Polysomnography; Polygraphy; NOX T3s; NOX A1.
Objectifs. Cette étude visait à mesurer la concordance de la mesure des stades du sommeil sur un moniteur portable de type III, actigraphie intégrée à la polygraphie (PG) à celle des tests de polysomnographie portable (PSG) enregistrés simultanément en laboratoire.
Méthodes. Au total, 12 participants ont été référés au laboratoire de médecine du sommeil. Chaque volontaire a été appliqué simultanément à l'équipement PSG et PG. Les mesures collectées sont IAH, IAC, IAO, IAM, la plus faible SpO2, la moyenne SpO2, le temps de sommeil total, le temps REM, le temps NON - REM et d'autres mesures, qui ont été analysées par le logiciel NOXTURAL. Pour les PG (NOX T3), les stades du sommeil ont été estimés à partir d'enregistrements basés sur les caractéristiques extraites des ceintures d'actigraphie et de pléthysmographie par inductance respiratoire (RIP) par l'algorithme Nox BodySleep™.
Résultats. Une bonne corrélation a été trouvée en TST (temps du sommeil total) sur NOX-A1 et NOX-T3 (test t apparié p=0.266); Spearman' rho=0,944, p<0,001). L'analyse de Bland-Altman du TST a montré une différence moyenne de -6,33 avec des limites de concordance de -6,88 à 8,03 dans le TST, ce qui illustre une concordance étroite du TST sur deux appareils. L'IAH mesuré par les T3 sans capteur nasal n'a pas montré un bon niveau de concordance par rapport au NOX-A1, la moyenne différente était de -2,28 et les limites de concordance étaient de -6,76 à 2,2.
Conclusion. Les NOX T3 ont démontré un bon accord sur le TST par rapport au PSG. Par conséquent, les NOX T3 peuvent être utilisés pour évaluer l'efficacité du sommeil chez les patients souffrant de troubles du sommeil et pour évaluer correctement l'IAH selon le TST.
MOTS CLÉS: Actigraphie; Test d'apnée du sommeil à domicile; Polysomnographie; Polygraphie: NOX T3; NOX A1.
INTRODUCTION
The deep sleep stages are important in normal functioning to replenish the immune system, and proper metabolism and growth. Patients with sleep-related breathing disorders suffer from sleep fragmentation and apnea during sleep. When they start to fall into deeper stages of sleep, their upper airway collapses and interferes with their normal breathing and this interference forces the body to revert to the lighter sleep stages to continue better respiration [1]. According to the International Classification of Sleep Disorders-Third Edition (ICSD 3), sleep-related breathing disorders are divided into four sections: obstructive sleep apnea (OSA), central sleep apnea (CSA) syndromes, sleep-related hypoventilation disorders, and sleep-related hypoxemia disorder [2]. Sleep-related breathing disorders have reduced stage N3 and REM sleep and this leads to excessive daytime drowsiness as proper, efficient sleep is not obtained throughout the night [1]. For that reason, recognizing treating sleep-related breathing disorders plays an important in improving the quality of life of the patients.
For a long time, polysomnography (PSG) has been well-known as the gold standard for diagnosing OSA. In the current Clinical Practice Guideline for Diagnostic Testing for Adults OSA (2017) of the American Academy of Sleep Medicine, in the absence of PSG or home sleep apnea testing (HSAT), they recommend that the clinical tools questionnaire or prediction algorithms not be used to diagnose OSA in adults. However, PSG is time–consuming, expensive and typically requiring overnight continuous monitoring of multiple physiologic processes, including sleep/wake state and respiratory functioning. Home sleep apnea testing (HSAT) is less resource-intensive and it can bring comfort for patients, increased access to testing, and decreased cost. Moreover, HSAT can be performed in their home environment with fewer attached sensors during sleep [3]. In Vietnam, in a prospective, observational, multicenter study (Duong - Quy S. 2018), the prevalence of OSA in the general adult population is quite high (8.5%) [4]. With a lower cost, PG is more suitable in resource-limited settings like Vietnam, or when the patient is unable to leave the home or healthcare setting for testing. Our study aims to measure the agreement of the sleep stages measurement of type III portable monitor with actigraphy in the comparision of portable polysomnography testing.
METHODS
Participants
12 volunteer adults were referred to the Sleep medicine laboratory of the Vietnam Society of Sleep Medicine to participate in the study. Study subjects are volunteers over 18 years old who have never undergone tests such as respiratory polygraph, sleep polygraph or prior OSA treatment. Exclusion criteria were the past diagnosis of sleep apnea, obesity hypoventilation syndrome, narcolepsy, COPD, heart failure, shift - work, jet lag, irregular work schedule in the past 3 months, history of oxygen therapy, have a clinically unstable condition or have a newly diagnosed conditions within the previous 2 months, and other comorbidities.
Devices
NOX T3s (Nox Medical, Inc., Reykjavík, Iceland) is a type 3 portable device with a weight of 65 grams and dimensions of 79 mm (W) x 63 mm (H) x 21 mm (D). Besides the pulse oximetry, airflow, respiratory effort like other PG devices, NOX T3s can measure actigraphy while the patients sleep, then a software called Nox’s BodySleepTM utilizes Artificial Intelligence (AI) intended to differentiate 30-second epochs into the REM and NREM sleep states, and Wakefulness. Nox’s Body SleepTM technology estimates sleep states by processing respiratory data through advanced algorithms utilizing NOX calibrated respiratory inductance plethysmography (RIP) technology. It does not require traditional EEG, EOG and EMG signals typically used to determine changes in brain state during sleep stages.
Procedure
All participants were informed of the purpose of the study. All activities in the study were in compliance with the principles outlined in the Declaration of Helsinki. All participants were instructed how to sleep using these two devices, and their measurements were collected through one night with both NOX T3s and NOX A1 simultaneously. Participants were instructed to sleep in whatever position they were comfortable except on the prone position and they were allowed to take their regular medications. Within 6 hours before measuring, participants were not allowed to use drugs such as alcohol, tobacco, coffee, or narcotic pain relievers.
This study evaluated the agreement between the results between two devices NOX A1 and NOX T3s. The collecting measurements are AHI, central apnea index (CAI), obstructive apnea index (OAI), mixed apnea index (MAI), lowest SpO2, average SpO2, total sleep time (TST), REM time, NON – REM time, and other metrics, which calculated by NOXTURAL software. For NOX T3s, AHI, CAI, OAI, and MAI are analyzed using calibrated RIP function.
NOX T3s data scoring
With NOX T3s, the signals were recorded during the portable monitor recordings: abdomen and thorax ventilatory effort signals through 2 respiratory effort channels, patient’s position, and activity through 3-D built-in acceleration sensor and oxy saturation through Nonin 3150 Pulse Oximeter. A recording of PG required at least 4 hours of monitoring containing the oxygen saturation and at least one of the respiratory signals (rib cage movement, abdominal movement). The quality of the PG was assessed by automated analysis of signal quality for oxygen saturation, airflow, abdominal movement, and thoracic movement.
The PG recordings were initially scored automatically using NOXTURAL software. According to the criteria of AASM 2017, the software program defined apneas as a more than 90% reduction in airflow from baseline for at least 10 seconds. Obstructive apneas were defined as an apnea associated with respiratory effort and central apneas were defined as an apnea during which respiratory effort was absent. Mixed apneas were defined as apnea during which respiratory effort was initially absent but appeared during the latter part of the event. The same start and stop times were chosen automatically. Hypopneas are defined by a ≥ 30% reduction in a respiratory signal for at least 10 seconds associated with a ≥ 3% reduction in oxygen saturation [3].
Because the portable monitor recording’s nasal pressure signal was absent throughout the recording, the flow signal derived from the rib cage and abdominal respiratory inductance plethysmography signals was used for scoring. The AHI on the NOX-T3s recordings was calculated as the average number of apneas and hypopneas per hour of analysis time. The sleep stages are analyzed by Nox’s BodySleepTM algorithm through processing respiratory data through advanced algorithms utilizing NOX calibrated RIP technology. This novel algorithm utilizes AI, intended to differentiate 30-second epochs into 3 sleep stages include the REM and NREM, and wakefulness.
NOX A1 data scoring
Polysomnography was performed according to the recommendations of the AASM. Because afraid of 2 sets of nasal sensors could cause nasal occlusion for the participants, we had one set of nasal sensors including a cannula and nasal thermistor that input to the PSG.
Using AASM 2017 scoring criteria, PSG was scored automatically with the aid of NOXTURAL software by a technologist without knowledge of the results of the portable monitor recordings. Apneas were scored when there was a ≥ 90% reduction in airflow from baseline for ≥ 10 seconds on the oronasal thermistor signal. The same criteria used to identify obstructive, central, and mixed apneas on the portable monitor recordings were used to score those events on PSG. Two separate PSG scorings were performed using different definitions for hypopnea: (1) events with ≥ 30% reduction in airflow from baseline for ≥ 10 seconds accompanied by ≥ 4% oxygen de-saturation and (2) events with ≥ 30% reduction in airflow from baseline for ≥ 10 seconds associated with ≥ 3% reduction in oxygen saturation and/or arousal. AHI on PSG was calculated as the average number of apneas and hypopneas per hour of sleep [3].
Data analysis
Continuous measurements are summarized in means and SD and categorical variables using counts and percentages. For each metrics, we use paired t-test to evaluate the difference between the measurements collected by each device. Then, we test the significance of the differences using statistical methods described by Bland and Altman plots. Specifically, subject-specific differences and subject-specific averages were calculated, and their correlations were analyzed using both statistic and graphic illustrations.
RESULTS
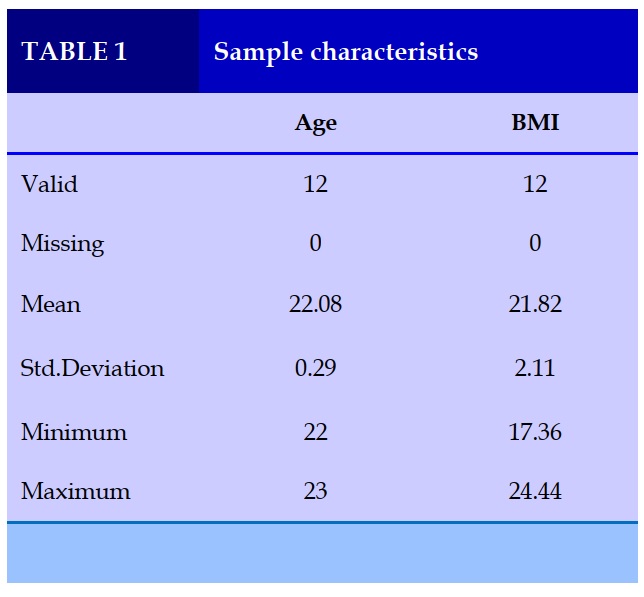
Table 1 shows the sample characteristics of the study. Subjects are mostly young (22.08±0.29 years of age), with BMI in normal level (21.82±2.11 kg/m2).
Agreement between NOX A1 and NOX T3s
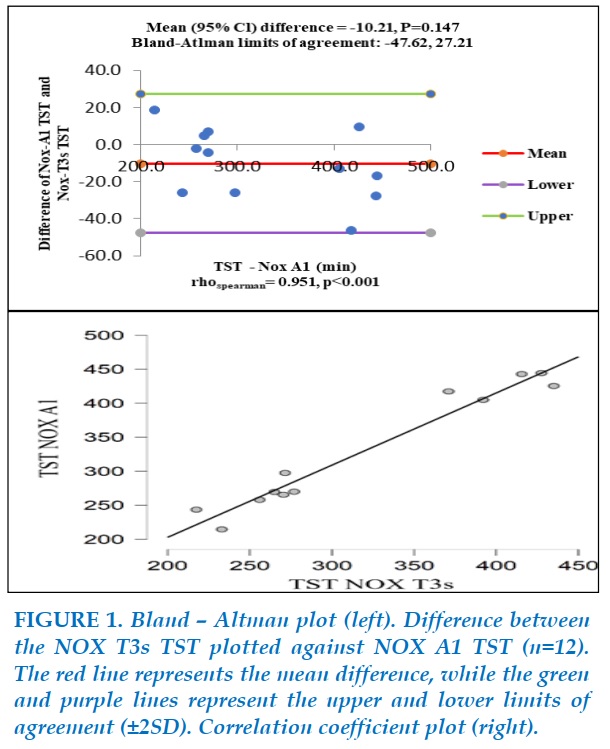
Figure 1 illustrates the comparison between NOX A1 TST and NOX T3s TST. Bland-Altman analysis of TST on NOX-A1 versus NOX-T3s showed a mean difference of -10.21 (P=0.147), with limits of agreement extending from -47.62 to 27.21. There was a positive monotonic relationship between TST on two devices (Spearman’s rho=0.951, P<0.001). Thus, TST recorded by NOX-T3s had a good agreement with TST recorded by NOX-A1.
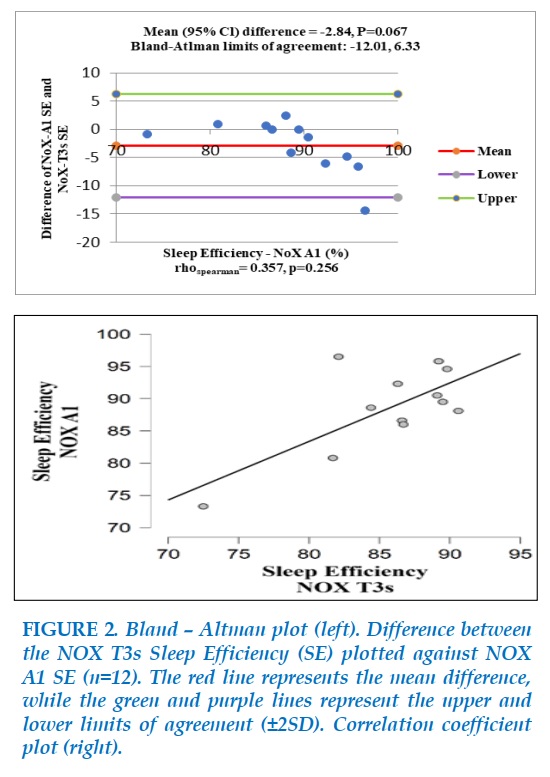
Figure 2 shows a negligible difference between NOX A1 Sleep Efficiency (SE) and NOX T3s SE (Bias=-2.84, p=0.067), with limits of agreement ranging from -12.01 to 6.33, which suggest an acceptable agreement in SE between the two devices.
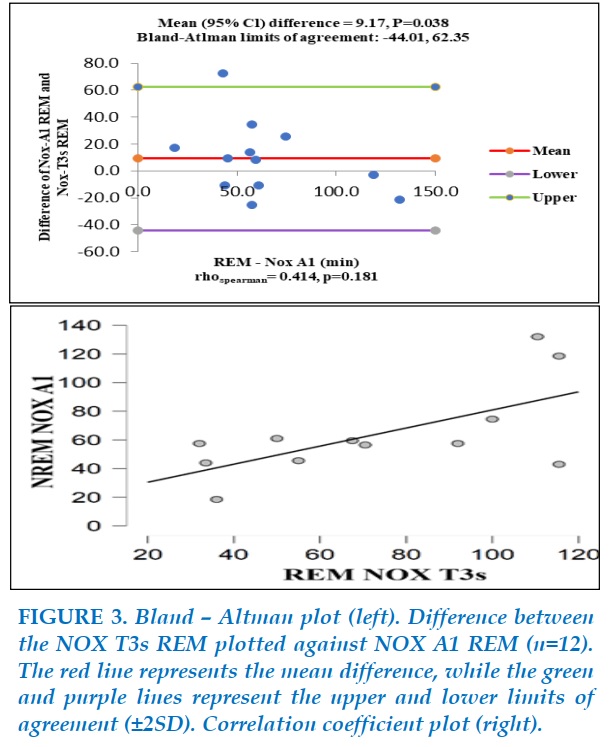
Figure 3 illustrates the comparison between NOX A1 REM – time and NOX T3s REM – time. There was not a monotonic relationship about REM-time between the two devices (Spearman’s rho=0.414, P=0.181).
Although the mean difference of 9.17 is not considerable (P=0.388), Bland-Altman analysis showed a large interval of two limits of agreement (-44.01 to 62.35) compared to the values of REM-time on NOX-A1 (0 to 140) and there was a subject-specific difference beyond the upper limits of agreement. Then, there was not a good agreement of REM-time between the two devices.
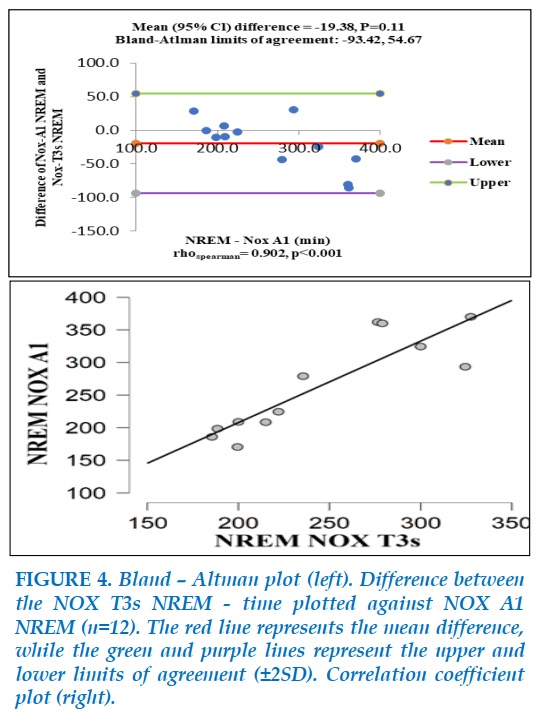
Figure 4 shows the comparison between NREM-time measured by NOX A1 with that measured by NOX T3s. A positive monotonic relationship was found (spearman’s rho=0.902, P<0.001). Bland-Altman analysis showed a nonsignificant mean difference of -19.38 (P=0.11), with limits of agreement ranging from -93.42 to 54.67. The same as REM-time, this interval was too large to consider a good agreement between the values of NREM-time of NOX A1 and NOX T3s.
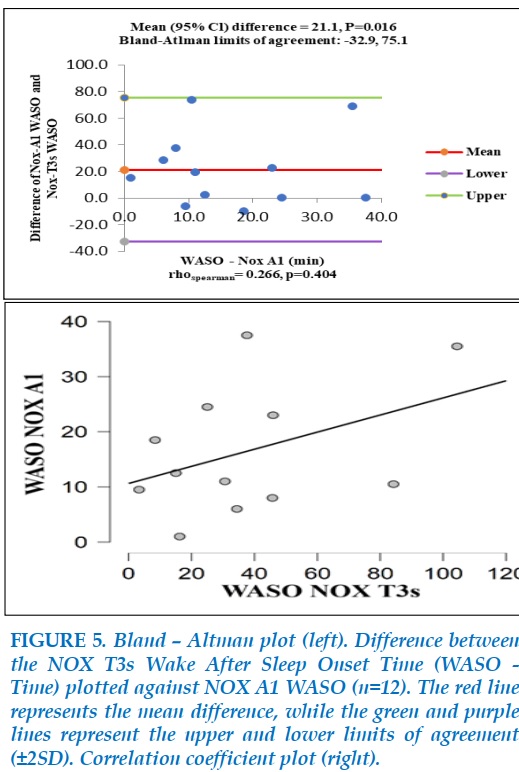
The comparison between NOX A1 Wake After Sleep Onset (WASO – time) and NOX T3s WASO – time is illustrated in Figure 5. The spearman’s rank correlation of Wake After Sleep Onset (WASO – time) between NOX-A1 and NOX-T3s was not significant (rho=0.266, P=0.404) and the WASO-time in NOX-A1 was different from one in NOX-T3s significantly (mean=-21.1, P=0.016). Thus, on the WASO-time, NOX-A1 and NOX-T3s were not correspond with each other.
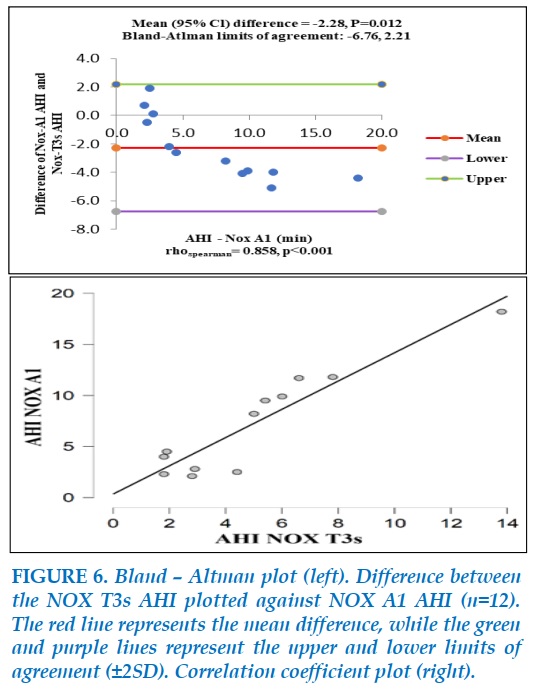
The comparison between AHI measured by NOX A1 and NOX T3 is showed in Figure 6.
There was a significant difference in AHI of the two devices (mean=-2.28, P=0.012). However, they showed a correlation when tested with Spearman ‘s rho (rho=0.858, P<0.001). AHI collected by NOX T3 seems to show lower than results in NOX A1, especially when AHI >5.
The limits of agreement ranging from -6.76 to 2.21 were not good enough for a good agreement between two devices.
DISCUSSION
In this small, clinic-based sample, the portable monitor (NOX T3s) demonstrated a strong agreement about the TST compared to the PSG (NOX A1). This is similar to a study of Dietz-Terjung and associations (2020) about the diagnostic accuracy of the novel Nox BodySleep™ algorithm, in which there was a high Spearman correlation (r=0.8) and a bias of 11 minutes for the estimation of Total Sleep Time. Sleep Efficiency was also valued with a good Spearman correlation (r=0.7) and a bias of 1.6% [5].
In this study, there were weak correlations between sleep stages REM, Non-REM, and WASO - time. This may due to the indirectly estimated sleep states. With NOX T3s, the 3-D built-in acceleration sensor collected data about the body’s position (x, y, z) coordinates. Then the data from the body’s position and the respiratory signals (rib cage movement, abdominal movement) throughout RIP belts were analyzed by NOX BodySleep™ algorithm to give information about sleep states. Collected data are downloaded to a computer for display and analysis of activity/inactivity that in turn can be further analyzed to estimate wake/sleep. When compared to PSG, actigraphy was found to be valid and reliable for detecting sleep in normal, healthy adult populations but less reliable for detecting sleep as sleep became more disturbed [6].
Recently, in a cross-sectional study of Carazo-Vargas and associations (2020), the volunteers simultaneously wore the NOX T3 portable polysomnography and an accelerometer (placed on the twist). This study found that the sleep efficiency recorded by the NOX T3 was lower than the recorded by the accelerometer, and both devices showed a poor concordance correlation coefficient. As a practical recommendation, Carazo-Vargas believe that the NOX T3 might be appropriate for home-based studies in clinical populations (e.g., sleep apnea, narcolepsy, hypersomnia) [7].
Regarding AHI, weak agreement was found between the two devices. As mentioned above, One set of nasal canula and oronasal thermistors were used in the PSG set. Thus, the NOX T3s estimated AHI indirectly based on the activity of the abdominal and chest and the results may be biased. In a descriptive study of Cairns (2014), to minimize the occlusion of the nasal passage, the participant wore a dual-lumen nasal canula, which allowed for simultaneous NOX T3s and PSG pressure sampling via a y-connector.
With this study, NOX T3s demonstrated very good measurement agreement compared to PSG and a high degree of sensitivity for detecting even mild OSA [8]. Similar to these findings, Liyue Xu’s study (2017) found that based on a threshold of AHI ≥ 5 events/h, NOX T3s had 95% sensitivity, 69% specificity, 94% positive predictive value, and 75% negative predictive value compared to PSG [9].
To our knowledge, this is the first study to find the agreement in the measurement of sleep stages of PG in Vietnamese adults.
There were limitations to our study. Firstly, this sample in this study was limited, therefore, it may not represent the patients with a high pre-test risks of moderate to severe OSA. Secondly, the monitor was applied by a trained technologist and studied in-laboratory testing, both of which would not occur under natural home conditions. For that reason, further investigation of the NOX T3s while at home is needed.
CONCLUSION
The results of our study showed that NOX T3s demonstrated a good agreement about TST when compared to PSG. Therefore, NOX T3s can be used to assess the sleep efficiency of the patients having sleep disorders and to evaluate AHI. Further study with a larger sample size is needed to evaluate the accuracy of the actigraphy integrated with PG for scoring sleep stages vs PSG accurately.
CONFLIT OF INTEREST
Non.
REFERENCES
1. Patel, A.K., V. Reddy, and J.F. Araujo, Physiology, Sleep Stages, in StatPearls. 2021: Treasure Island (FL).
2. Sateia, M.J., International classification of sleep disorders-third edition: highlights and modifications. Chest, 2014. 146(5): p. 1387-1394.
3. Kapur, V.K., et al., Clinical Practice Guideline for Diagnostic Testing for Adult Obstructive Sleep Apnea: An American Academy of Sleep Medicine Clinical Practice Guideline. J Clin Sleep Med, 2017. 13(3): p. 479-504.
4. Duong-Quy, S., et al., [Study about the prevalence of the obstructive sleep apnoea syndrome in Vietnam]. Rev Mal Respir, 2018. 35(1): p. 14-24.
5. Dietz-Terjung, S., Martin, A., & Schöbel, C., A Novel Algorithm for the Estimation of Sleep States Based on Breathing and Movement. Sleep, 2020: p. A170–A170.
6. Ancoli-Israel, S., et al., The role of actigraphy in the study of sleep and circadian rhythms. Sleep, 2003. 26(3): p. 342-92.
7. Carazo-Vargas, P., et al., Lack of Agreement between Polysomnography and Accelerometry Devices for Measuring Sleep Efficiency and Movement in University Students. Measurement in Physical Education and Exercise Science, 2020. 24(4): p. 291-302.
8. Cairns, A., et al., A pilot validation study for the NOX T3(TM) portable monitor for the detection of OSA. Sleep Breath, 2014. 18(3): p. 609-14.
9. Xu, L., et al., Validation of the Nox-T3 Portable Monitor for Diagnosis of Obstructive Sleep Apnea in Chinese Adults. J Clin Sleep Med, 2017. 13(5): p. 675-683.

FIGURES - TABLE
REFERENCES
1. Patel, A.K., V. Reddy, and J.F. Araujo, Physiology, Sleep Stages, in StatPearls. 2021: Treasure Island (FL).
2. Sateia, M.J., International classification of sleep disorders-third edition: highlights and modifications. Chest, 2014. 146(5): p. 1387-1394.
3. Kapur, V.K., et al., Clinical Practice Guideline for Diagnostic Testing for Adult Obstructive Sleep Apnea: An American Academy of Sleep Medicine Clinical Practice Guideline. J Clin Sleep Med, 2017. 13(3): p. 479-504.
4. Duong-Quy, S., et al., [Study about the prevalence of the obstructive sleep apnoea syndrome in Vietnam]. Rev Mal Respir, 2018. 35(1): p. 14-24.
5. Dietz-Terjung, S., Martin, A., & Schöbel, C., A Novel Algorithm for the Estimation of Sleep States Based on Breathing and Movement. Sleep, 2020: p. A170–A170.
6. Ancoli-Israel, S., et al., The role of actigraphy in the study of sleep and circadian rhythms. Sleep, 2003. 26(3): p. 342-92.
7. Carazo-Vargas, P., et al., Lack of Agreement between Polysomnography and Accelerometry Devices for Measuring Sleep Efficiency and Movement in University Students. Measurement in Physical Education and Exercise Science, 2020. 24(4): p. 291-302.
8. Cairns, A., et al., A pilot validation study for the NOX T3(TM) portable monitor for the detection of OSA. Sleep Breath, 2014. 18(3): p. 609-14.
9. Xu, L., et al., Validation of the Nox-T3 Portable Monitor for Diagnosis of Obstructive Sleep Apnea in Chinese Adults. J Clin Sleep Med, 2017. 13(5): p. 675-683.
ARTICLE INFO
DOI: 10.12699/jfvpulm.12.37.2021.1
Conflict of Interest
Non
Date of manuscript receiving
15/6/2020
Date of publication after correction
15/7/2021
Article citation
K. Le-Thai-Thanh, A. Nguyen-Viet, M. Quach-Thieu, QB. Le-Gia, D. Truong-Huu, N. Vo-Dinh, A. Nguyen-Tuan, T.Tran-Thi-Cam, TT. Tang-Thi, T. Nguyen-Van, S. Duong-Quy. Agreement of sleep stages measured by respiratory polygraphy integrated actigraphy vesus polysomnography. J Func Vent Pulm 2021;37(12):1-6.


Copyright: jfvpulm.com